
Make decisions with your business data
Revenue, bookings, occupancy and equipment in one dashboard. Filter by date, channel or location and download any table whenever you need it.
- Total revenue and revenue by business unit: school, rentals, sales and add-ons.
- Choose whether to view data by order date or activity date.
- Export any table to CSV in one click.
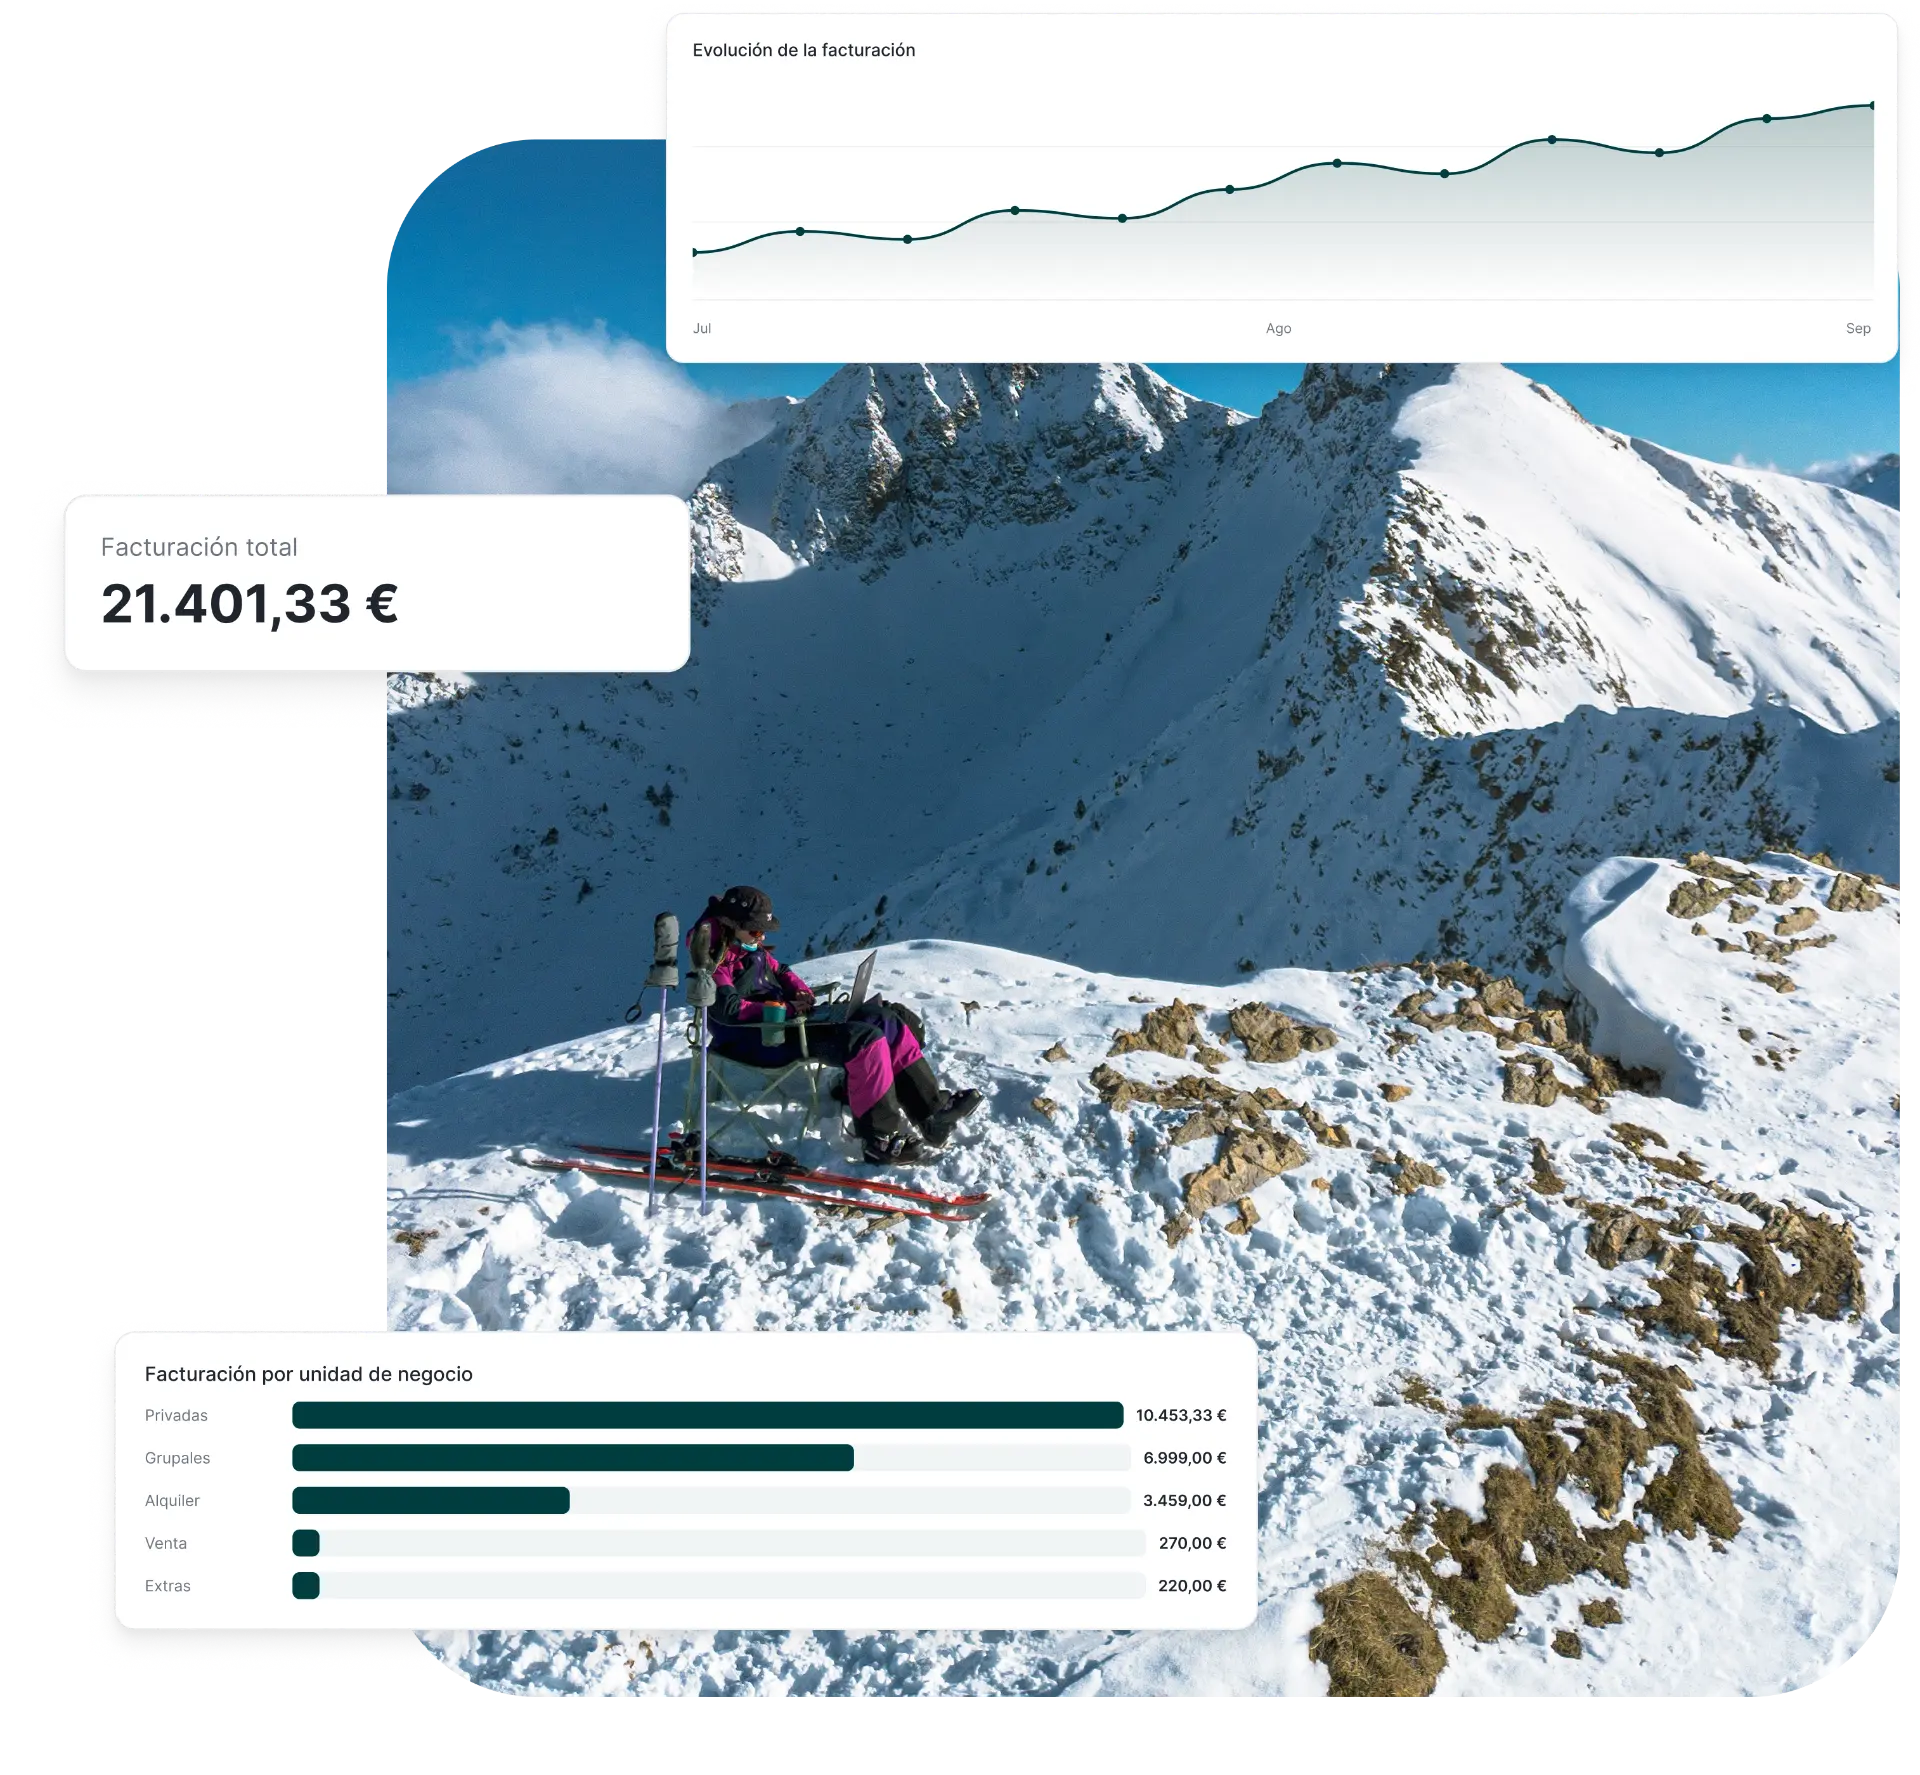
Your whole business in one dashboard
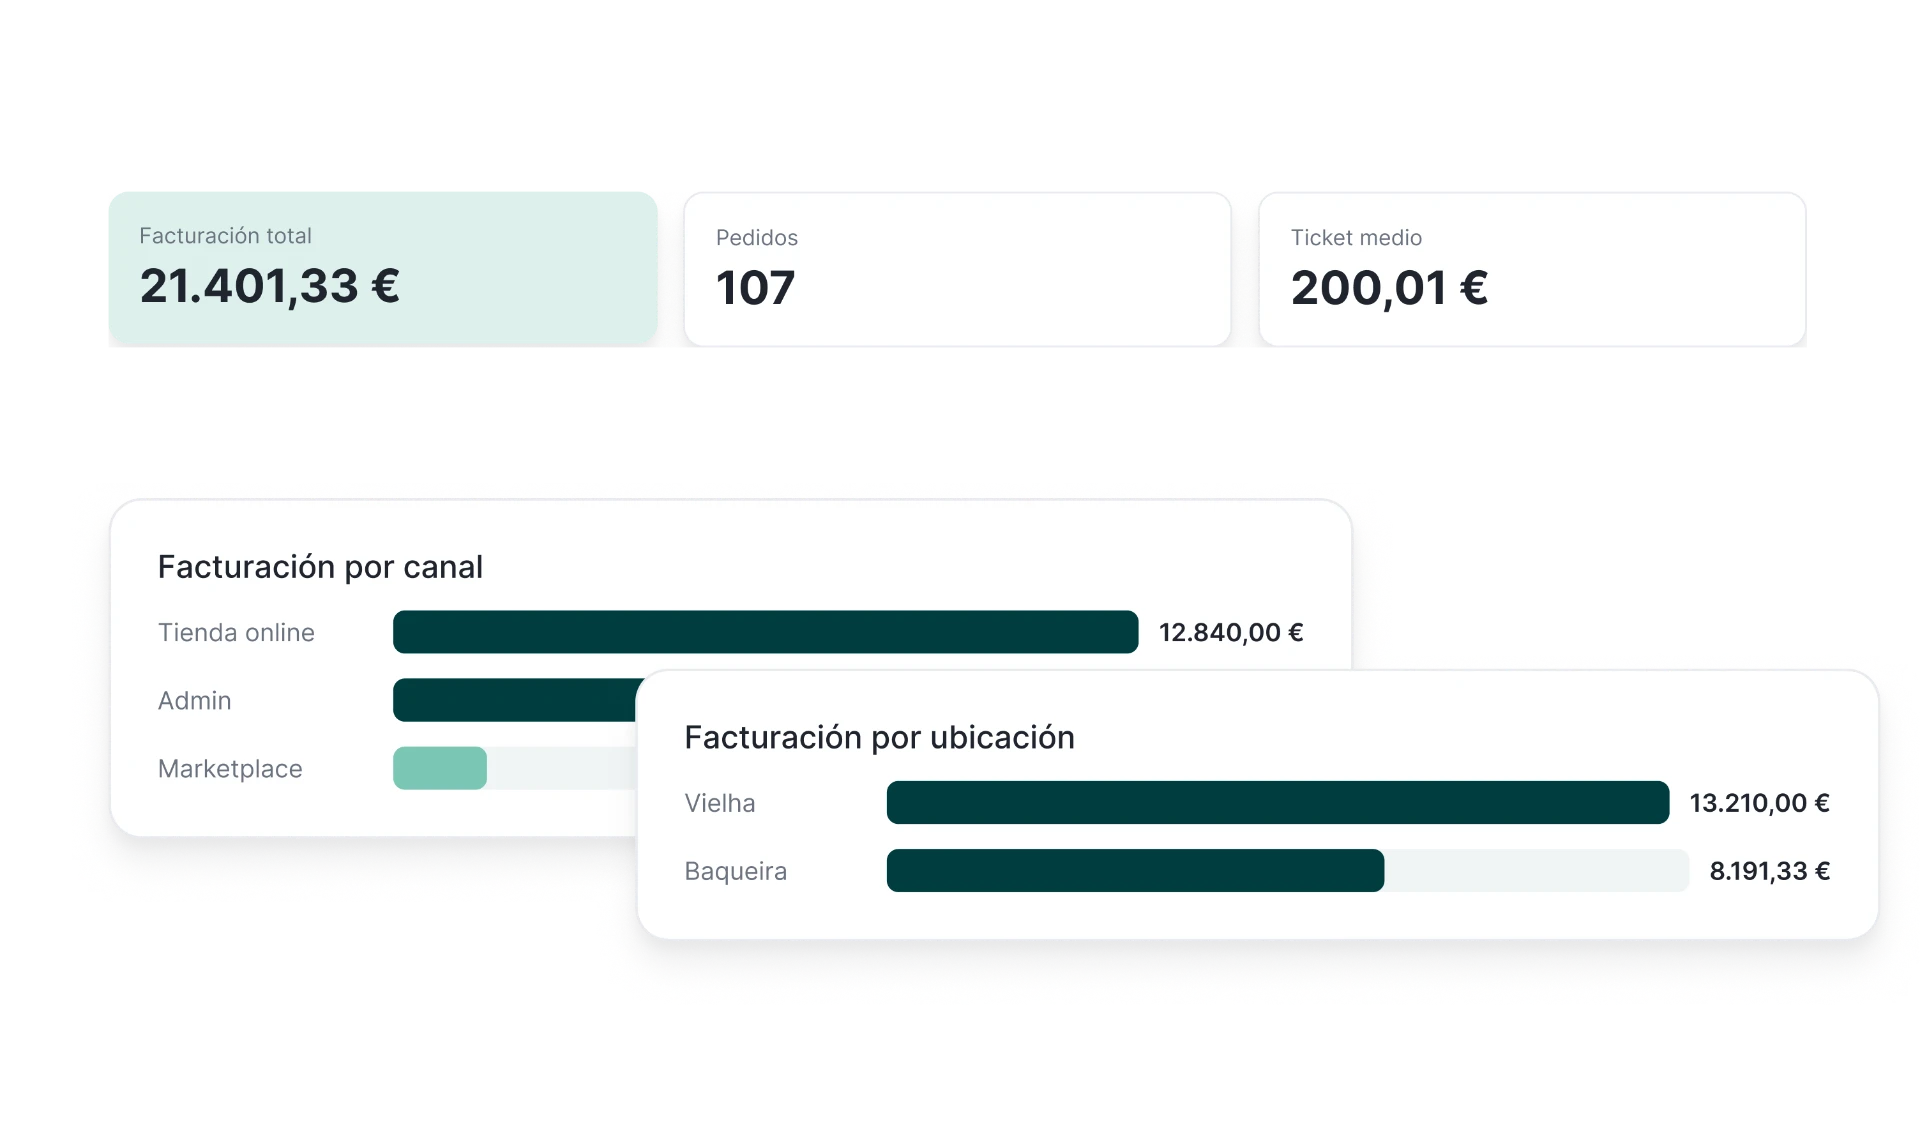
When you open Lueira, you see revenue, orders and average order value for your chosen period, without building a report.
- School, rental, sales and add-on revenue shown separately.
- Revenue trends over the period.
- Revenue by sales channel and location.
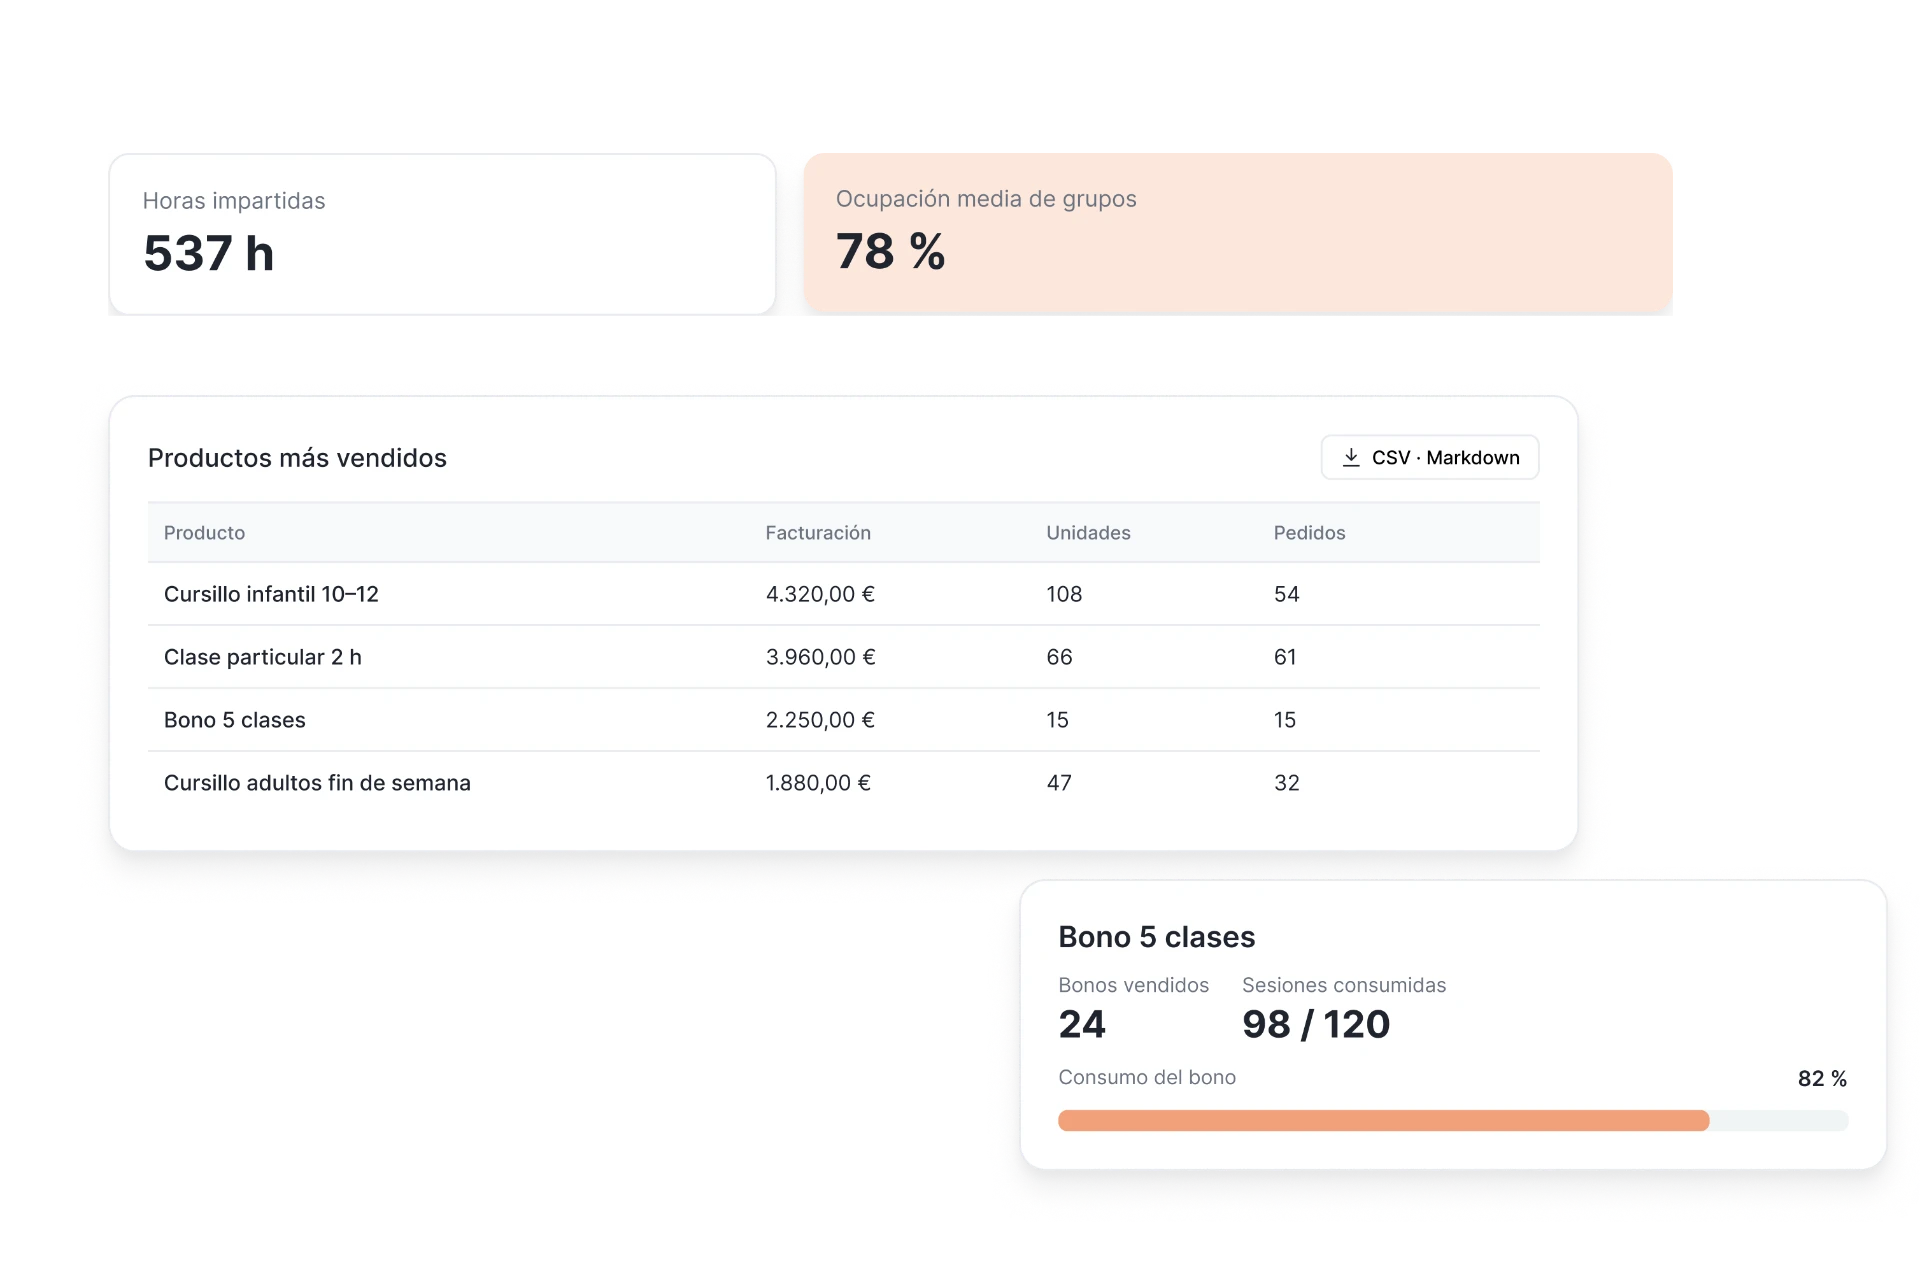
Find out which classes perform best
Check revenue from your classes and lesson passes, teaching hours and group occupancy. View data by sale date or by the date the class takes place.
- Best-selling products, grouped by product or activity.
- Group class students by day and start date.
- Statistics for each class or lesson pass: occupancy, hours and sessions used.
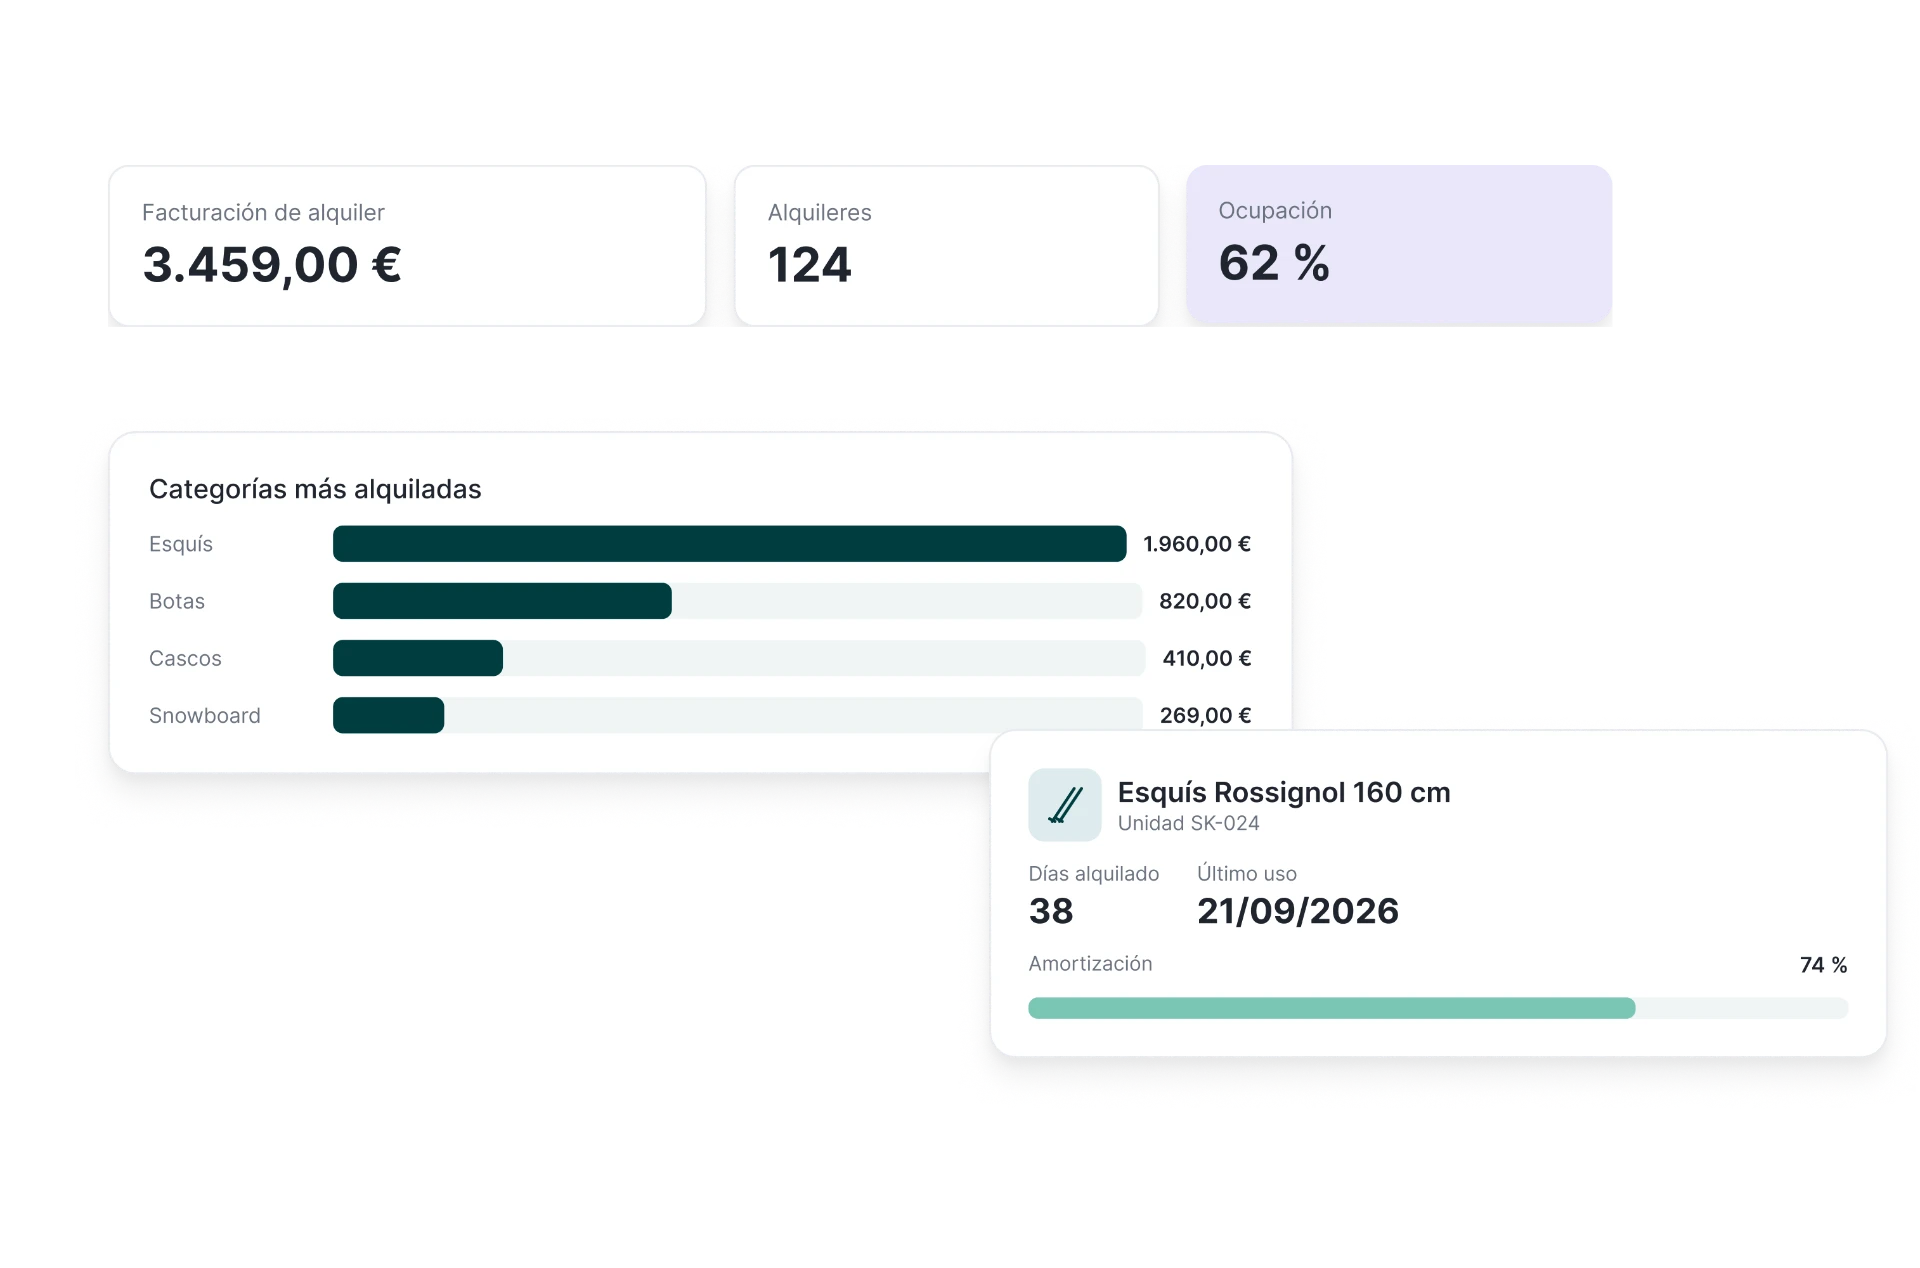
Know what gets rented and how it performs
Track revenue, rental numbers and equipment occupancy. Open any product or unit to see its individual data.
- Most-rented products and categories.
- Days rented and last-used date for each unit.
- Payback and margin for each item, when costs are configured.
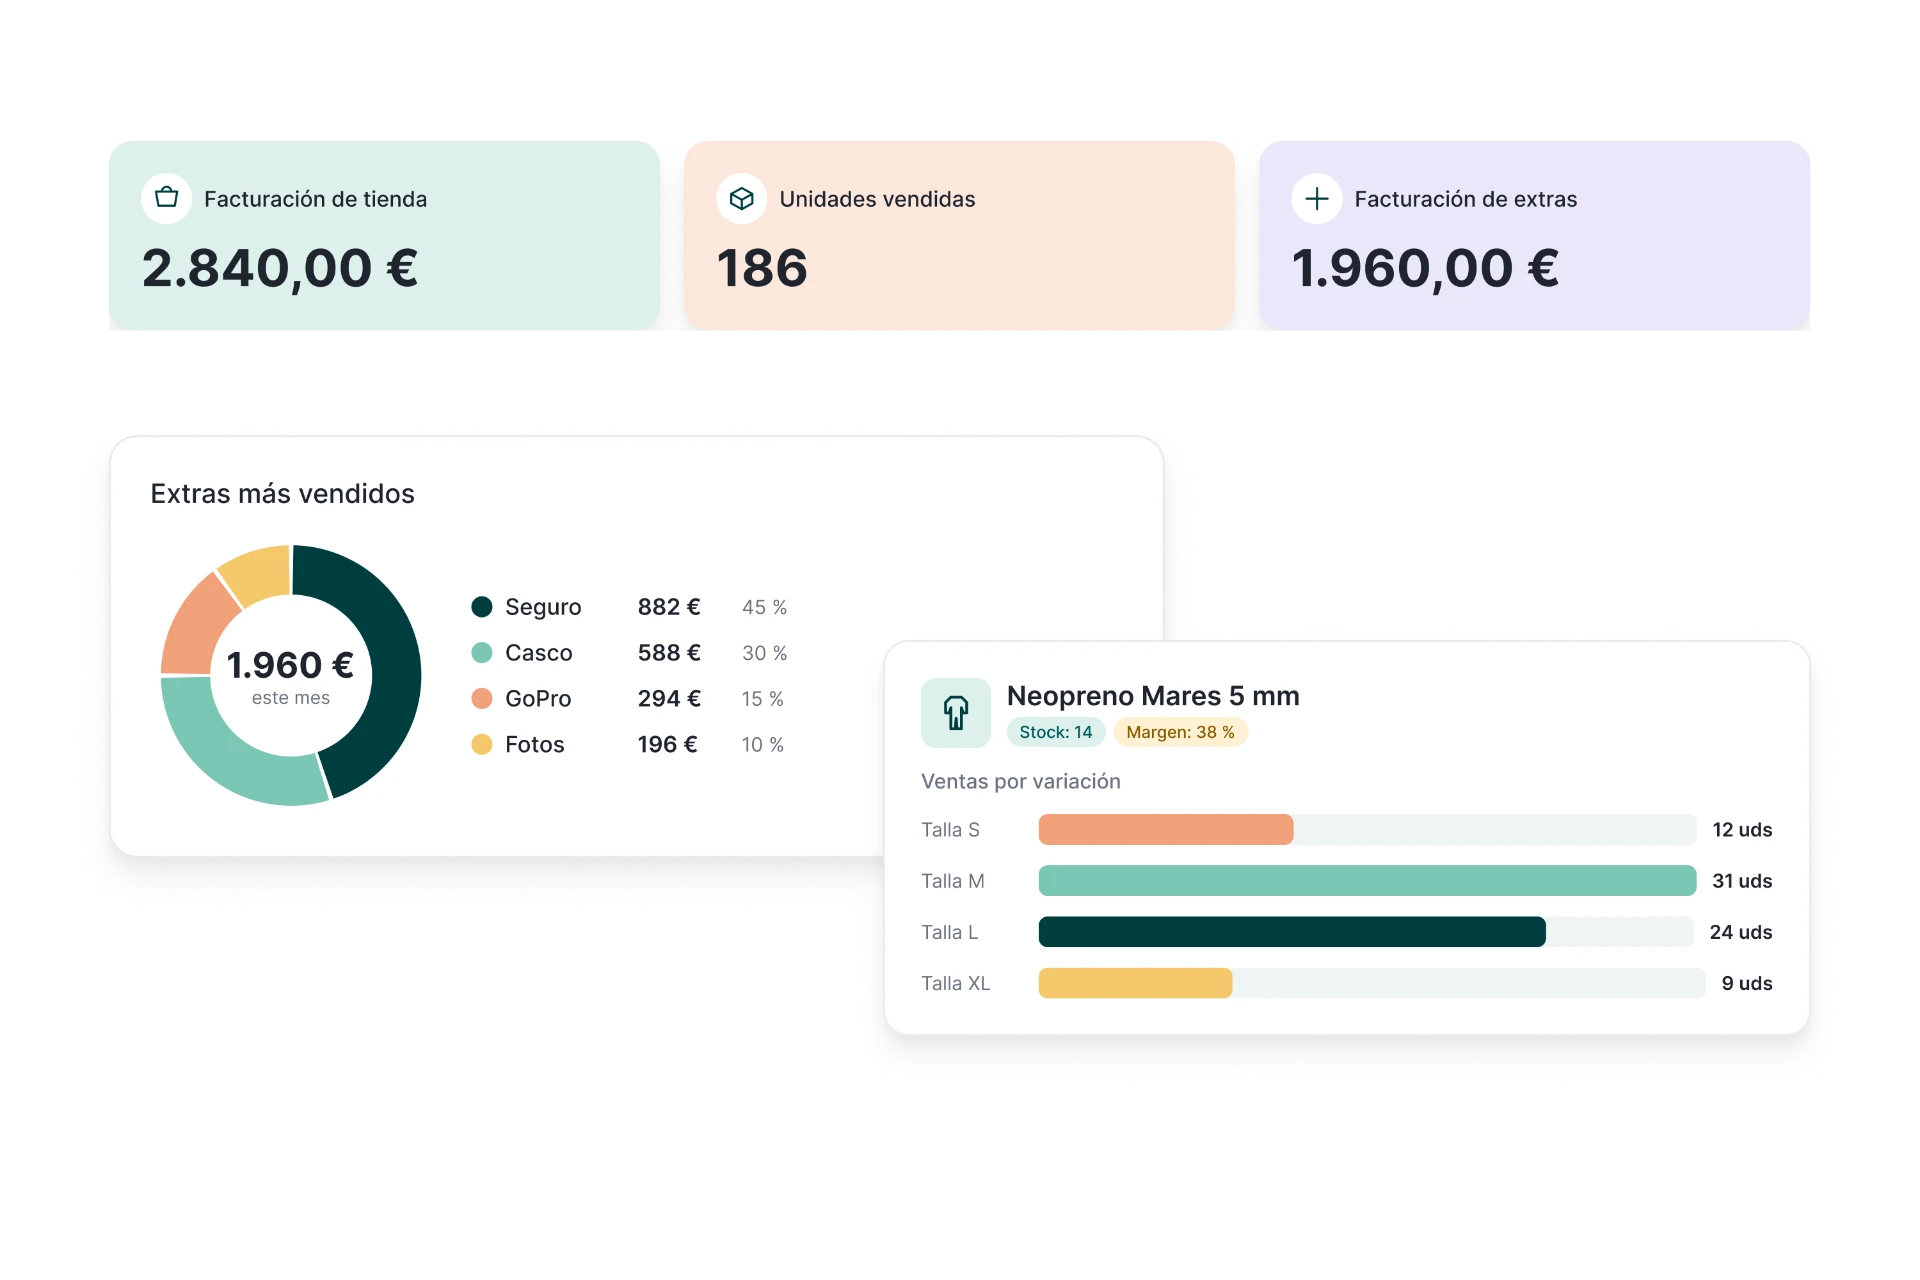
Discover your best-selling products and add-ons
Track store and add-on revenue separately, keeping classes distinct from equipment and accessories.
- Best-selling products and variations, by units or revenue.
- Current stock and margin for each product, when costs are configured.
- Best-selling add-ons and units sold for each.
Frequently asked questions about the statistics module
Statistics are recalculated automatically. Each screen shows the date and time of the last update, so you always know how current the data is.
Request your free demo!
Discover everything Lueira can do for your business.